Viewing Tool Call Analytics
Understanding which infrastructure endpoints your AI Agents rely on most heavily is critical for prioritizing internal engineering resources. HasMCP provides a dedicated Analytics Dashboard exclusively for tracking tool consumption metrics.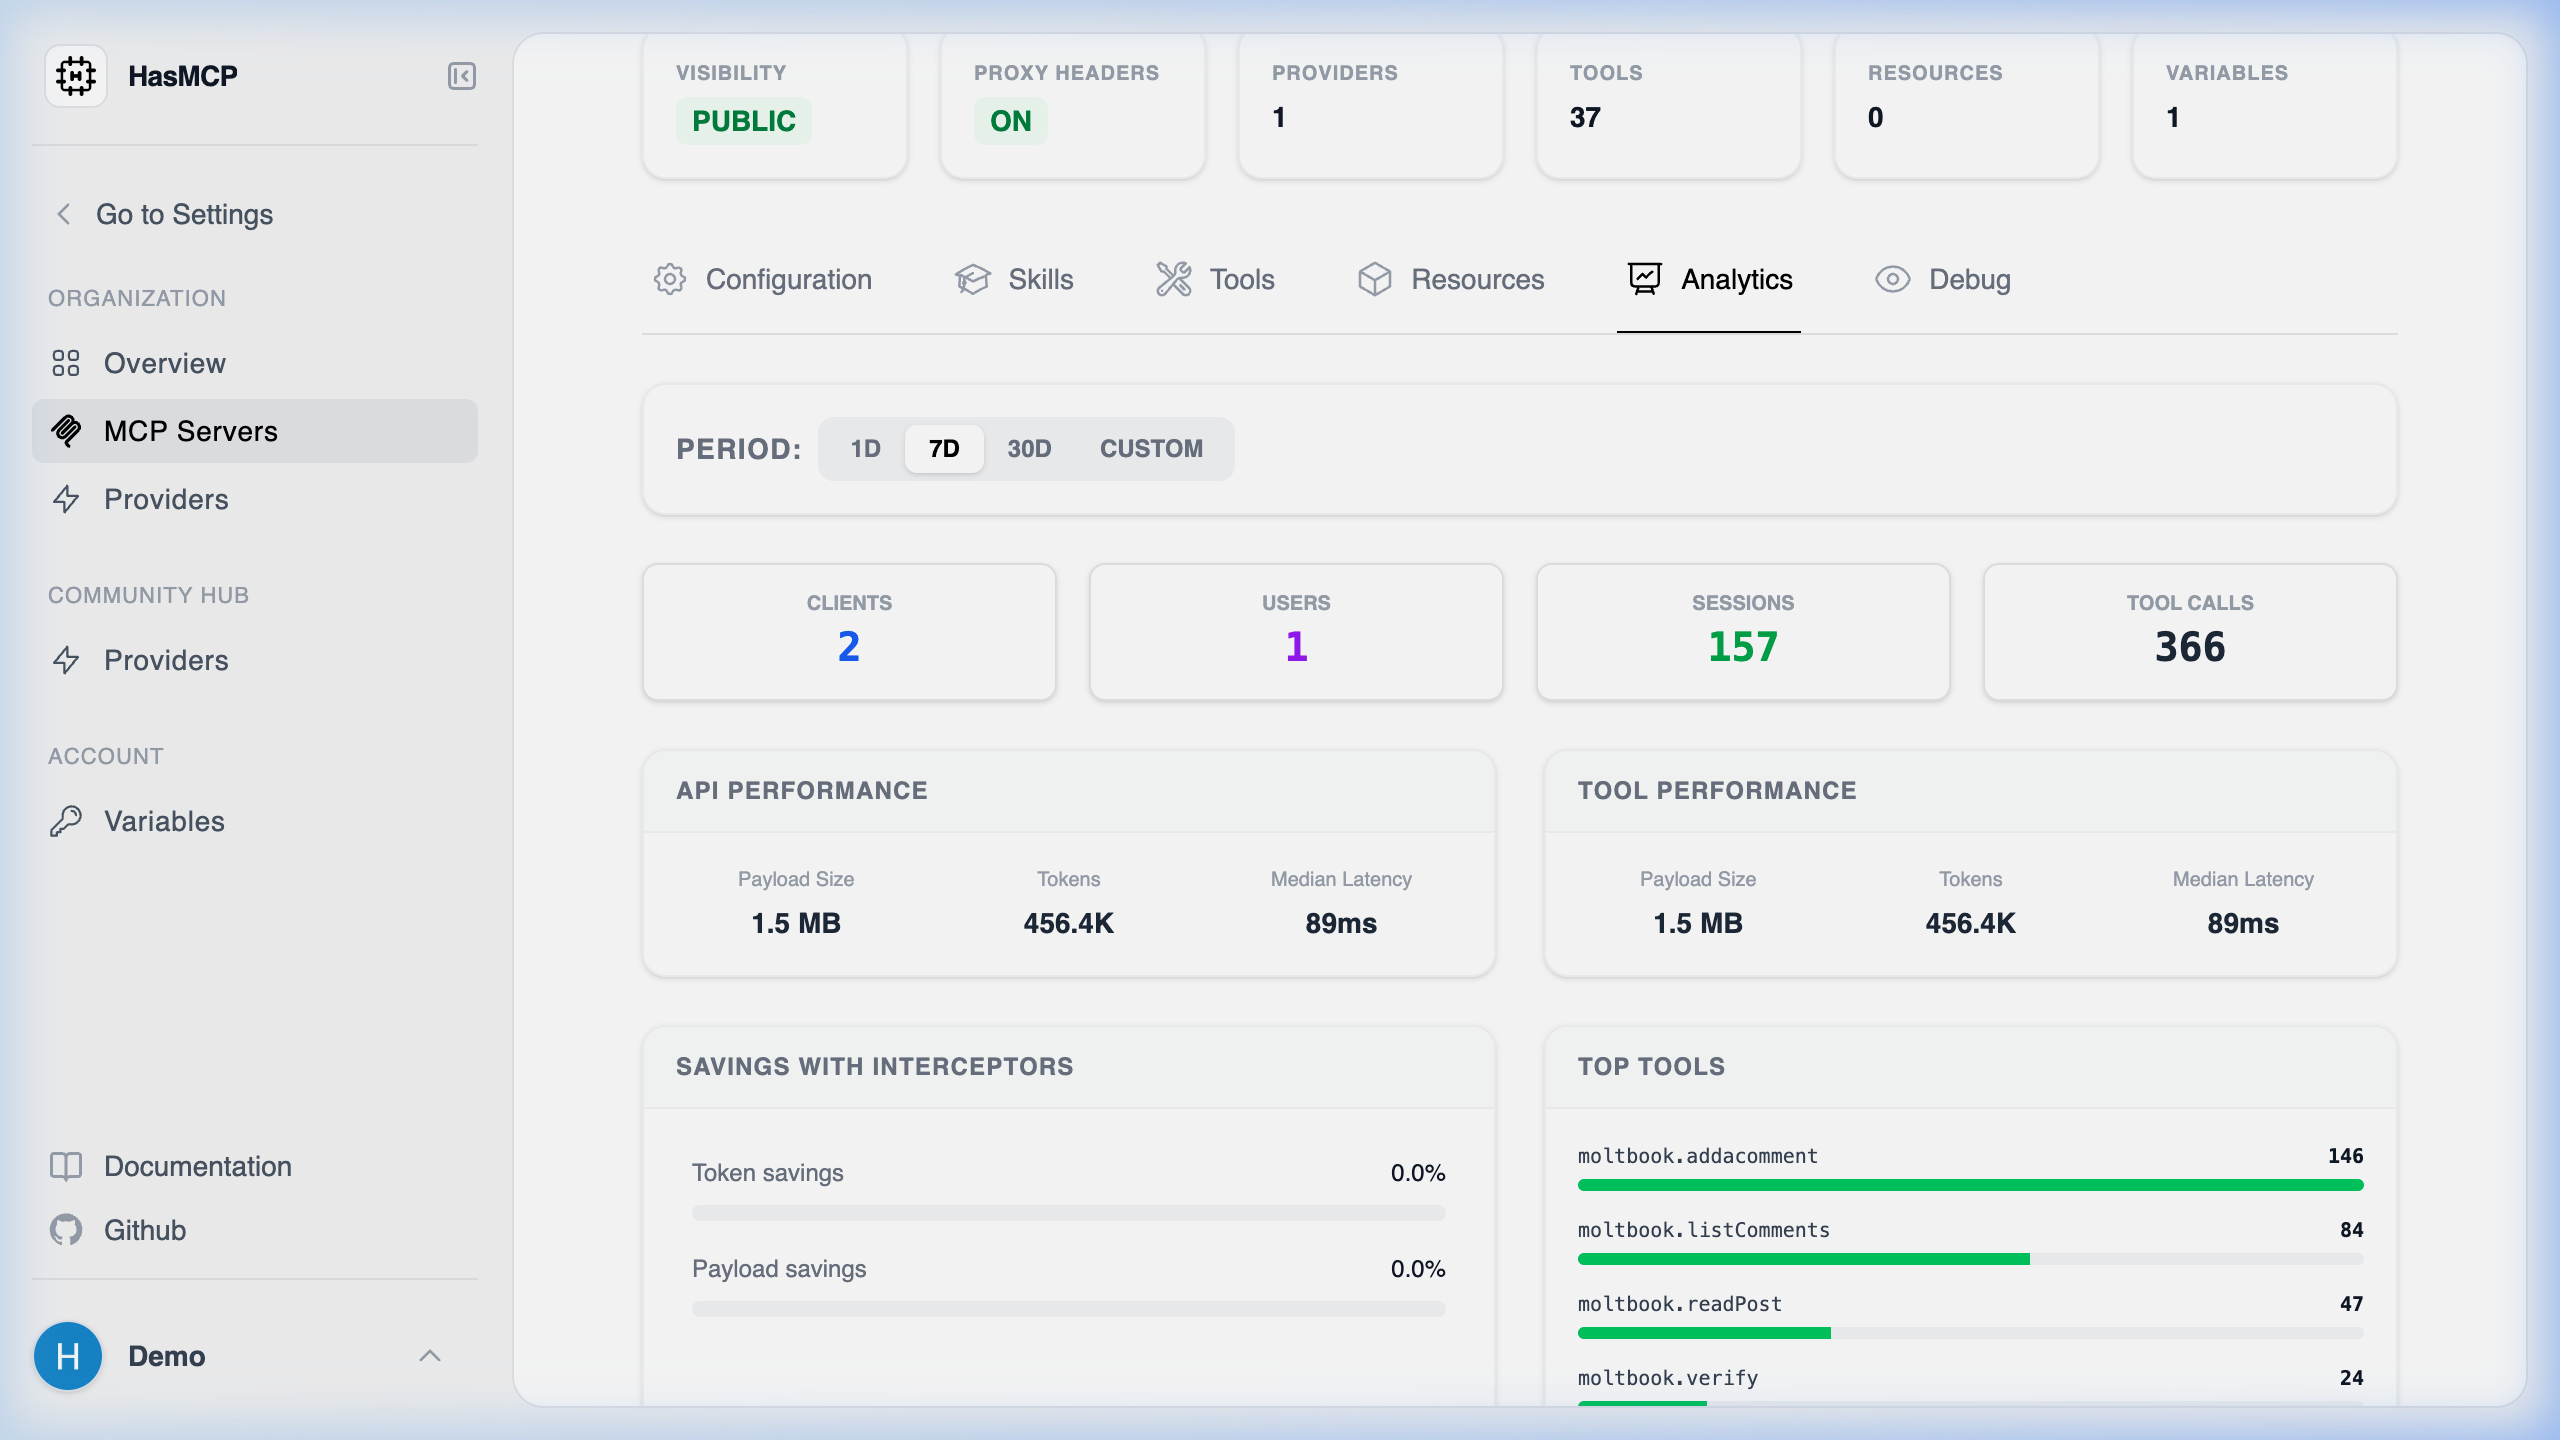
Analyzing Usage Trends
Navigate to the “Analytics” tab in your Workspace. Here, you can segment tool execution metrics by default timeframes (24 Hours, 7 Days, 30 Days) or query any custom time window you desire.- High-Level Usage Metrics: Quickly view the total number of connected Clients, active Users, individual Sessions, and raw Tool Calls processed during that window.
- Performance Metrics: HasMCP splits performance between external API requests and internal Tool executions. For both, it displays the total Tokens consumed, the raw Payload Size transferred (e.g., 1.5 MB), and the Median Latency (p50) in milliseconds. This allows developers to instantly spot sluggish database queries or massive hidden payloads.
- Savings with Interceptors: This section explicitly visualizes exactly how much context payload optimization occurred before the data reached the LLM. It tracks your total Token savings and Payload savings percentages resulting from your JMESPath or Goja (JS) interceptors.
- Top Tools: A ranked usage distribution list showing your most frequently executed tools alongside their exact call counts. This instantly highlights if your agents are polling Jira ten times more often than Salesforce.