The Streaming Debug Console
When configuring dynamic Provider Tools or writing custom JavaScript interception logic, developers frequently need to understand exactly what the LLM is doing natively. Instead of blindly parsing raw HTTP execution logs or configuring a dedicated external ElasticSearch instance, HasMCP provides a real-time Streaming Debug Console.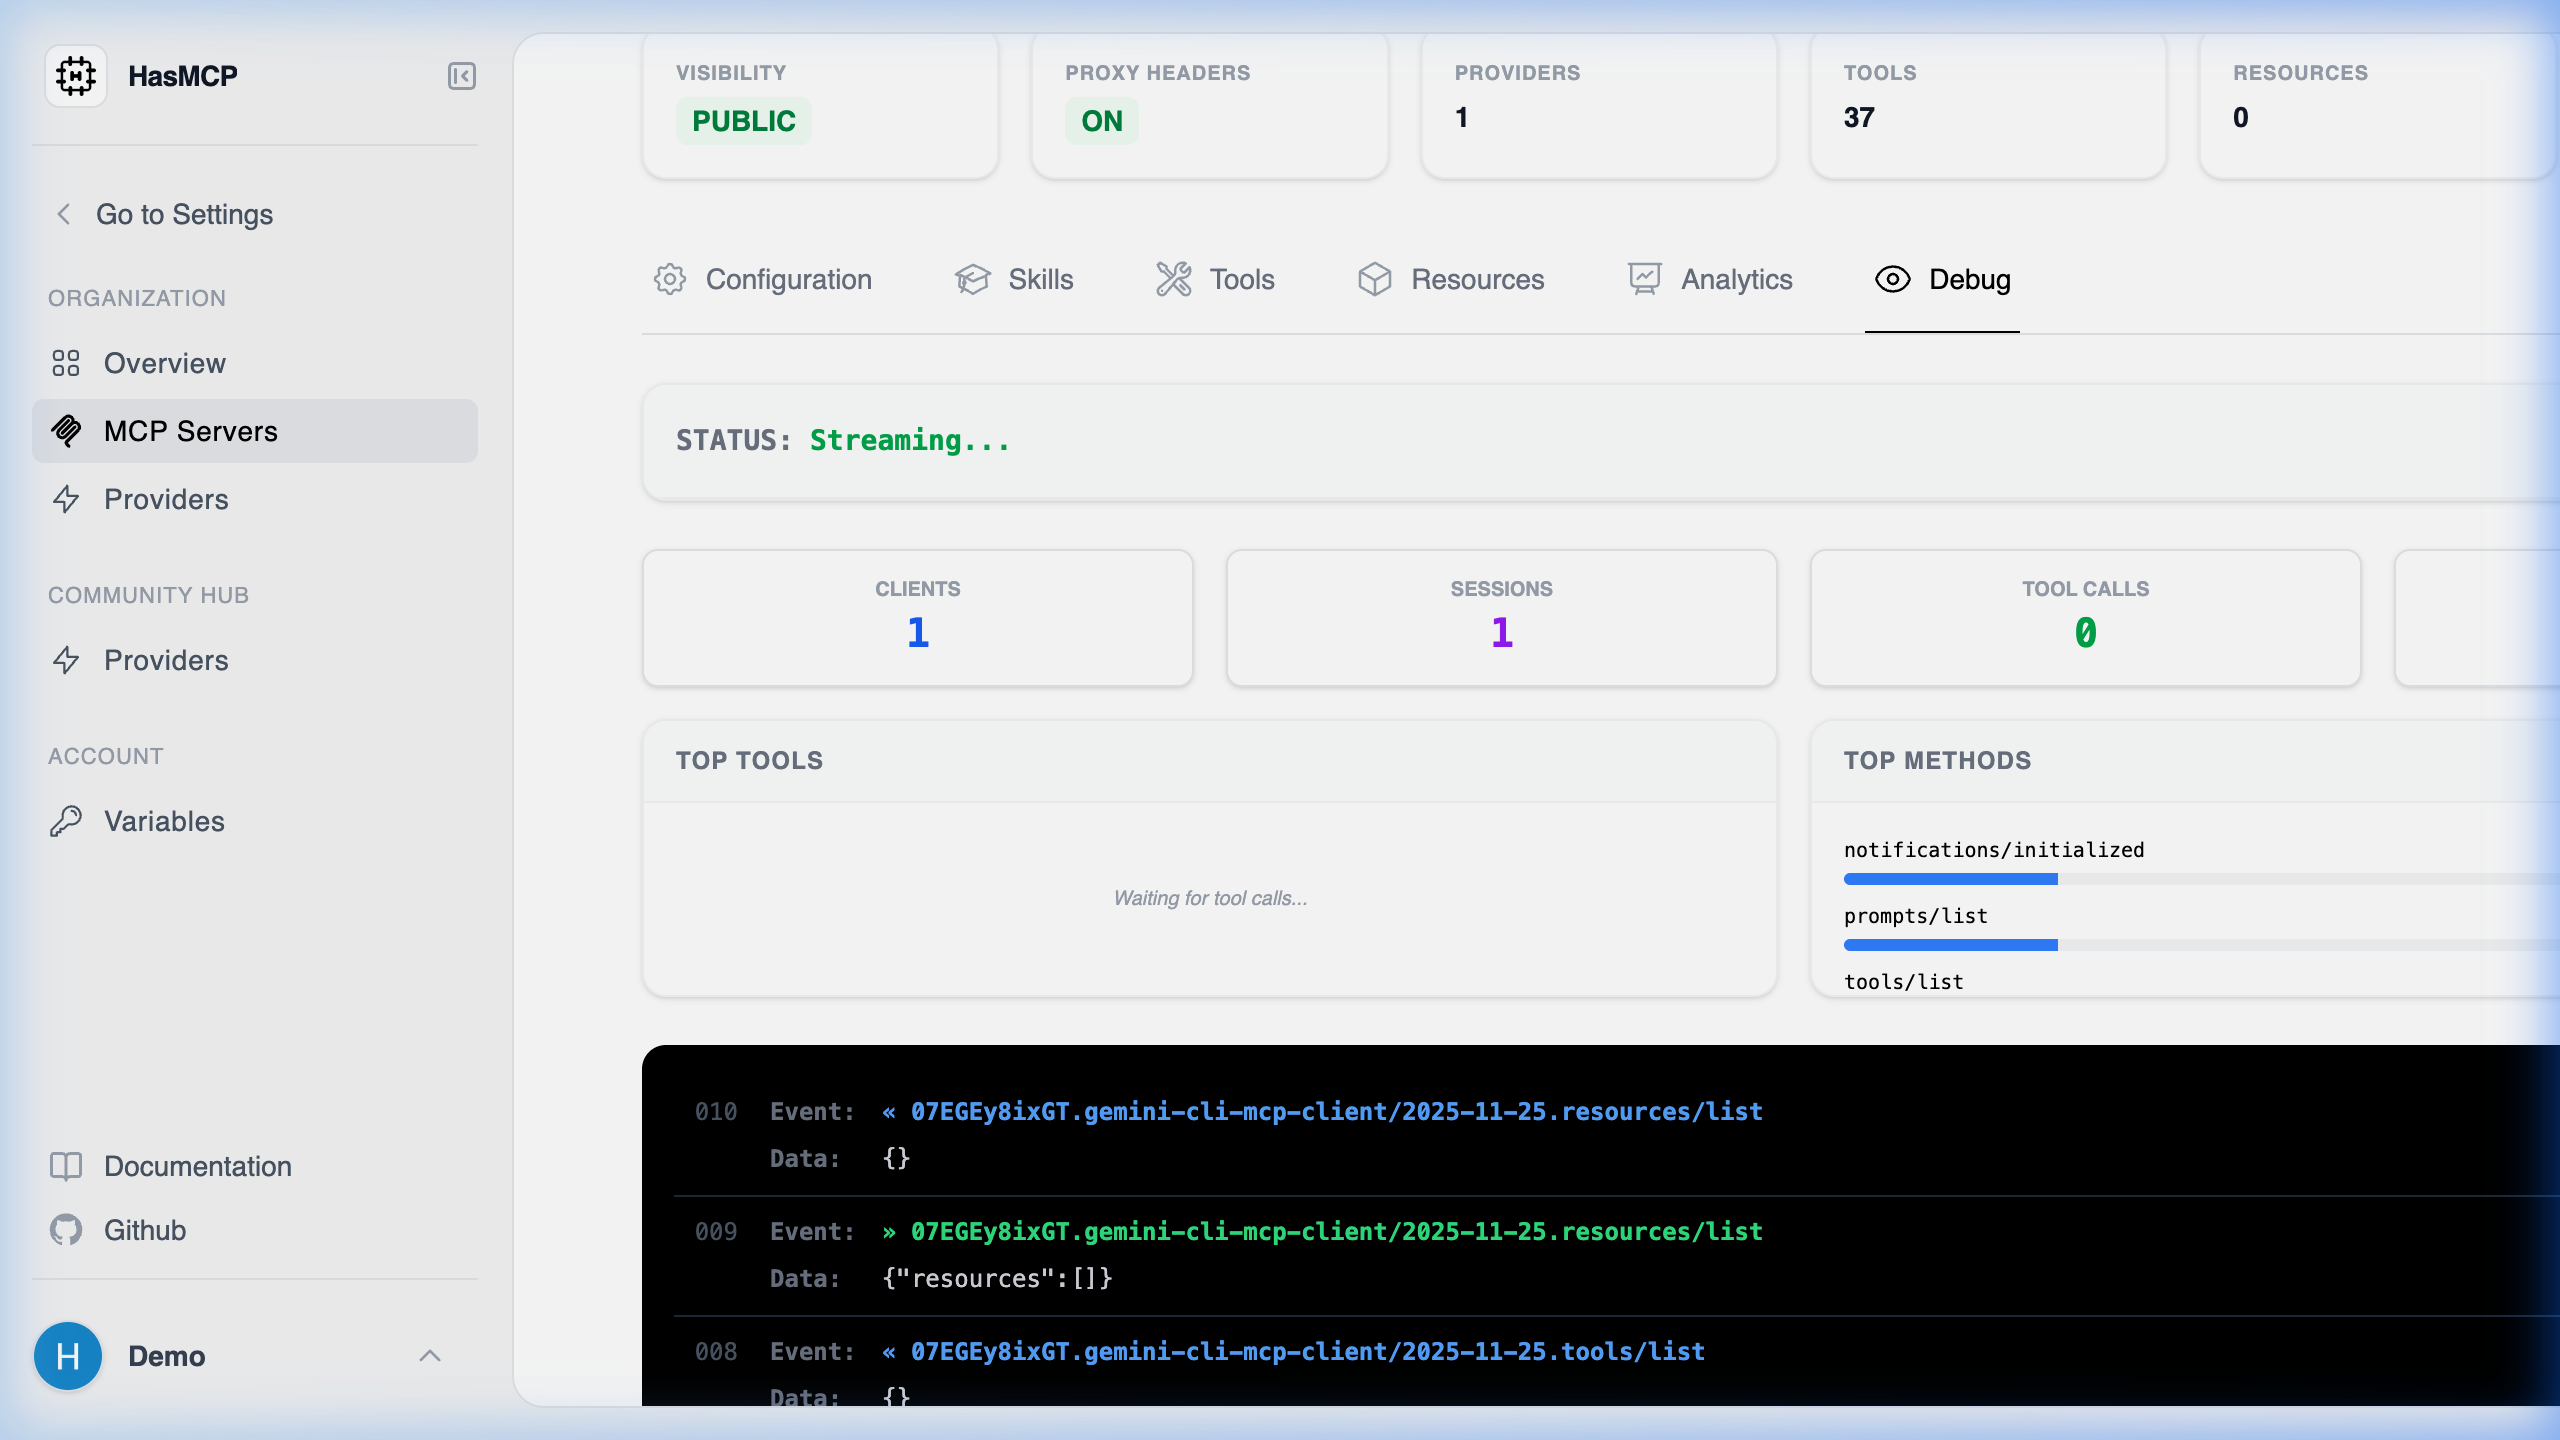
Observing Live Traffic
The Console operates as an interactive SSE (MCP Streamable HTTP) stream, piping live event logs straight into your browser. It instantly surfaces critical diagnostic milestones:- Authentication Failures: Was the user rejected because they lacked the proper Role-Based Access Control permission, or did their Oauth Access token expire?
- Provider Timeouts: Did the target REST API take 12 seconds to respond, violating the proxy timeout rules?
- LLM Connection Errors: Did the local Claude Desktop client unexpectedly drop the TCP session midway through an active execution block?
- JavaScript Runtime Errors: Did your
onBeforeReturnGoja interceptor crash because it attempted to parse anullJSON node natively?